


After a miserable August for stocks and other asset classes, the downward trend continued in September. Overall, the third quarter will go down in history as one of the worst quarters for equity investors. In our monthly review, we take a closer look at Value stocks and their destiny, also in comparison to Growth stocks. Beside many other consequences, the absence of a widely expected FED rate hike in September also raises the question if and when Value can end its more than a decade long underperformance against Growth.
US equity markets, measured by the S&P 500, lost about 2.6% in September. The most popular equity segments did not offer protection but brought very negative surprises. The most prominent biotech ETF fell 11% in September after it had fallen by 11% in August. The German stock market ended the month 5.8% in the red. The higher sensitivity of German stocks to global growth was one factor. Another was the diesel scandal at Volkswagen that drove down the DAX. German utilities have seen a multi-year slide that seems to have ended in September. In the last few days of the month, the two largest utilities recovered significantly and continued to move higher until at least Mid-October. RWE, one of the two, rose 40% in a few days from bottom to the current top.
End of Value Stock’s Underperformance?
Value stocks, well advocated by Warren Buffet and other prominent investors, had a hard time in the last few years. The argument for Value stocks is still valid and has not changed over the last decades. Companies with a convincing business model and with high and predictable cash flows should be selected. At the same time, the stock price of these companies has to be cheap. The difference between the purchasing price of the stock and the intrinsic value should provide the buyer with a margin of safety.
After building a Value stock portfolio with such stable operational businesses, bought at low valuations, an increase in the share price does not have to occur immediately. Other buyers need to be convinced, the demand for the stock has to increase. A lot of time might pass, during which the stock price does not increase or even decrease, and the fundamentally sound picture for the company can fade. Looking back, you held very good companies, bought at a low price but you could not benefit from the selection in any form.
Numerous empirical studies showed that Value stocks outperformed Growth stocks over longer time horizons in the past. The historical outperformance against the overall market is so high that many investors are committed to Value investing exclusively. Since the end of the dotcom crash in 2002, these investors did not benefit from the Value factor as it underperformed the overall market and Growth stocks.
Within our systematic global equity strategies we are not biased to any of the so called investment styles which most often encompass only Value and Growth. At the end of the day, only an increase in the stock price (including dividend payments) is all that counts. Therefore, we implement an internally developed style rotation. Value exposure can and will be replaced by Growth exposure for certain times. Implicitly we assume that during certain market phases the overall Value universe can outperform the overall Growth universe and vice versa. The behavior of market participants as well as the constitution of major indices might serve as technical arguments for the rotation. Also economic foundations exist. A low interest rate environment supports Growth initiatives because new, risky ideas can be tested and realized at comparably lower costs (interest on debt). The dependence on operational cash flows is lower. Amid the absence of a rate hike by the FED in September, market participants already started to speculate on a continued rally of Growth stocks, also compared to Value stocks.
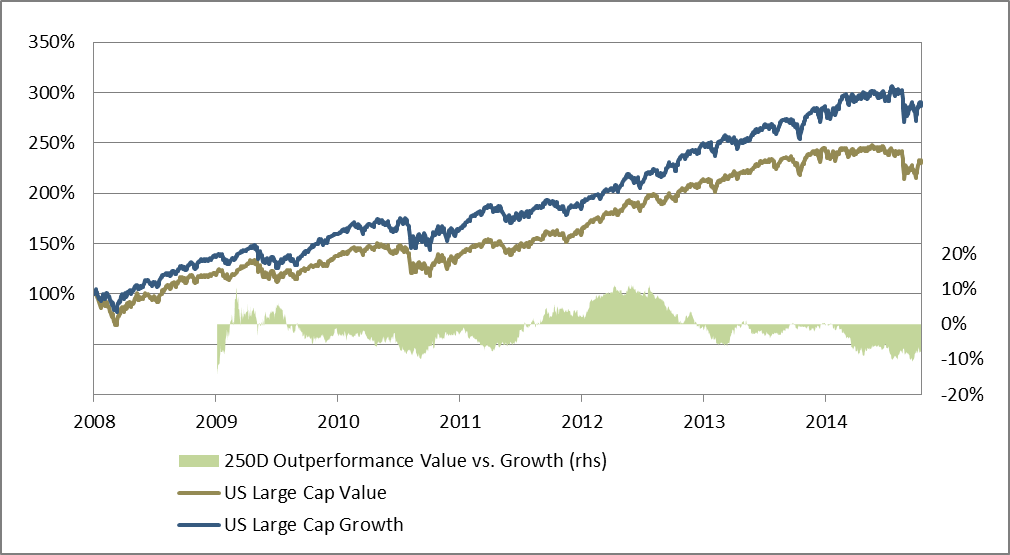
The chart above exhibits the performance of Value and Growth, starting from the bottom of the 2008 financial crisis. Growth performed significantly better than Value.
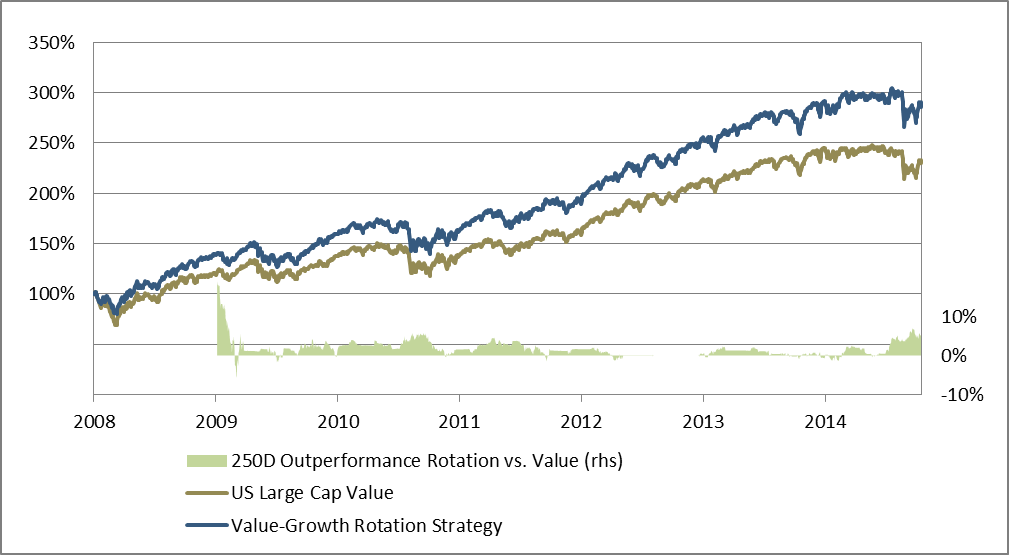
The following chart compares Value with our rotation strategy. It is obvious that the rotation strategy outperformed Value by a wide margin, over the last seven years. At second glance, the chart reveals that the rotation strategy corresponds to the Growth line. Indeed, the hypothetical return of the rotation strategy is nearly identical with the performance of Growth stocks. Also, the maximum drawdown is similar. It suggests that the rotation strategy was positioned in Growth all the time. The opposite is the case. For 60% of the time, the rotation strategy positioned in Value and only 40% of the time Growth was the style of choice. In each calendar year, at least one rotation happened. The rotation strategy only underperformed Value in two out of seven years. The underperformance in both years was less than 1%. These characteristics make us confident that the rotation strategy does not only provide good performance figures for the past years but is well prepared to deliver attractive performance in case Value will have its comeback.
On purpose, we are not ideologically bound to any one style. From our investment philosophy we prefer to select a segment of the equity market or rotate into one of the mentioned styles for which an increase in the short-term is likely, compared to selecting fundamentally very convincing stocks that do not exhibit any positive indication for a price increase.
A few weeks ago, the signal in our rotation changed from Growth to Value. It has been positive for Value since then. Although none of our systematic strategies builds or even relies on forecasts, it looks like a good indication for better days to come in the Value investing space.
Outlook
The market participant’s interest in the US central bank’s rate hiking decision seems to decline. After weak US economic data for September, the speculation on another quantitative easing came to light in discussions.
At the end of the day, it is company earnings that count and motivate investors to buy and hold stocks. Therefore, we believe the focus will increasingly shift to China. Besides the usual cloud of mistrust about China’s economic data, the shift from industrial production to services makes it harder to assess the economic environment and the growth trajectory of the second largest economy. Leading indicators like commodity prices, imports, and exports helped in the past to evaluate the growth picture but might lose their explanatory power amid the shift to services.
With the most recent US and European data in October, the upward trend for the economic development in both regions was confirmed. In addition, for Europe some leading indicators we prefer to look at are quite positive and consistently improving.
At the time of writing, it seems our simple and short-term oriented signal on market timing after a drawdown will become active. According to this strategy, equity market exposure is held for one month or a rotation out of defensive into more offensive equity segments for one month is implemented. The condition is a drawdown of 10% for US stocks with a subsequent recovery reaching 95% of the former high. If the signal becomes active, it will be the tenth time in less than six years. On average, the stock market returns during these periods were quite impressive. See “Embrace the next Stock Market Drawdown”
Did we see the beginning of the year-end rally with the recovery in early October? Were increased forecasts for global growth the driver behind the upward move or is the current recovery just a technical reaction to an oversold market in the third quarter? The question remains open, for now.