


In June, once again the Greek debt crisis made the headlines and influenced investor sentiment on both sides of the Atlantic. Over the first half of 2015, the divergence of equity market performance between the US and Europe was striking, although it decreased in the second quarter. In June, the volatility difference between the two regions stood out. We did a short study to see what influence the current volatility environment could have on equity markets.
In addition to employment and economic activity data for the US, a GDP growth of 4% for Spain has to be mentioned as a positive development. On the macro level the default of Puerto Rico grabbed some attention in the last few days. In contrast, the oil price vanished from the news headlines as it stabilized around 60 USD over the last weeks.
The appreciation of the Euro against the US Dollar stopped in the second quarter. The European currency could even gain some ground against the US currency. This gain was generated mainly in June, a month that saw a volatile sideward move in this currency pair. Our strategies indicate a continuation of the general upward trend for the US Dollar.
US and European equities ended last month with a significant downward move. Within our global equity strategy the NASDAQ and the MDAX kept their position in the US rotation and EU rotation strategies, respectively. Although June was not a good month for both indices, since the beginning of the year each one ranks first within its selection universe.
Mexico outperformed Brazil, justifying its position within the Emerging Market rotation. However, the Latin American country already lost its place by the end of June. China was the substitute and together with India forms the Emerging Market allocation within the global equity multi-strategy. China is represented by the Hang Seng, not by the more speculative domestic indices.
Regional Divergence
In the second quarter, the difference between the best European sector and the one with the worst return was just 10%, compared to a difference of around 30% in the first quarter. A similar picture evolved in the US. The 21 sectors we constantly monitor and consider for sector rotation exhibited a return range of 35% in the first quarter which fell to less than 20% in the second quarter. If you remove the high flyer sector Biotech (no similar index in Europe), the range decreases further.
The uncertainty about the outcome of the Greek crisis might be part of the interpretation, as well as the season of the year (low activity) in combination with already high returns for some investors, given they participated in the stock markets over the last years. Some market participants became cautious, either due to collecting sufficient return – especially in Europe this year – or amid falling valuations of once safe government and corporate bonds in their portfolios. A decision on market exposure in general seems to dominate a selection of sectors or stocks (see narrow P/E range for stocks).
While sectors within Europe and within the US did not exhibit much divergence, the movement of the major indices of both regions did. In the first quarter, European equities outpaced their US peers by a wide margin. Depending on which indices you prefer, Europe beat the US by between 14% and 22%. In the second quarter, the US took the lead but only with outperformance in the single digits.
Volatility Environment a positive Factor?
Looking at the most important volatility indices for Europe and the US, a remarkable difference comes to light. Last week, we did a short study to see if this current volatility environment could indicate the future direction for equity markets.
First, we found that the monthly volatility difference between Europe and the US is currently at its highest level in five years.
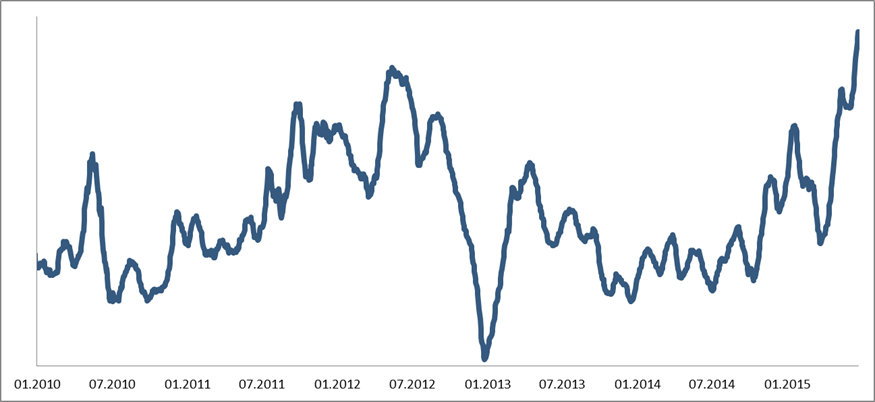
Chart 1: The chart shows the monthly average of the difference between the volatility index for Europe and the volatility index for the US. Since 2010, the figure was never higher than it is currently.
Afterwards, we analyzed the relation between volatility differences and the equity market performance over the next months. In fact, the three month return of European equities increases with an increase in volatility difference at the beginning of the period. More interesting, the outperformance of European equities against their US peers improves with increasing volatility differences. Admittedly, the relation comes with high variation. Together with only a small amount of data points, statistical significance might not be given.
The final step was to put averages aside and focus on the extreme values. Just one other period with similarly high volatility difference could be observed over the last five years. In summer 2012, these high levels came hand in hand with a surprising dissolution of the parliament in Greece. The end of the extremely high volatility difference period marked a bottom for the stock markets. The following three months offered a summer rally during which Europe outpaced the US by a significant margin.

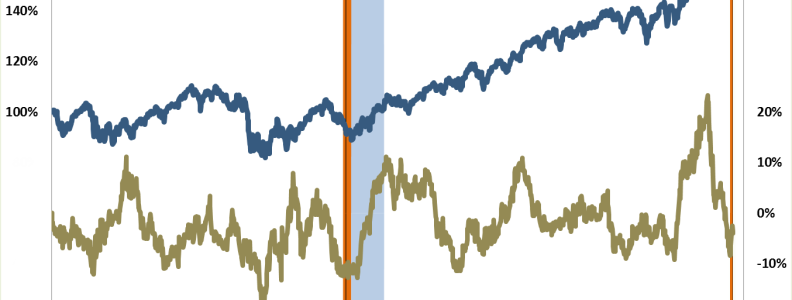
Chart 2: The blue line is a simulated passive strategy which is constantly invested in Europe and the US with equal weights (lhs). The golden line displays the outperformance of European equities against US equities over three month periods (rhs). The orange colored areas highlight the current period with extremely high volatility differences and the last time the figure was on a similarly high level (May 2012). The three month period after the high volatility difference environment ended in summer 2012 is marked by the light blue range.
Outlook
From our perspective – and this means from the perspective of our systematic strategies – the positive environment for stocks continuous. The investor group that utilizes rotation between the two regions Europe and US seems to shape the current equity landscape. When a decision to rotate into Europe can be responsible for a huge return difference, a sector or stock selection becomes secondary. Of course, these investor types are not a new group but with less participation from other investor groups, the marginal buyer/seller can determine the direction. It means we might still see the big performance differences between Europe and the US, with a positive indication for European equities.
Just as a food for thought, we like to mention Detroit. The city defaulted in 2013 on its debt. Outside of the US, no one cared about it or even recognized this event. The metropolitan region of Detroit has nearly the same economic power (measured by GDP) as Greece has. Can you compare a large country which includes very different economic regions but with one monetary policy with the EU, especially since the EU and the ECB support government debt and socialize the debt burden? During the Detroit default, a German business paper wrote “…Off all things, it is the default that provides hope for better times.”