


After stock markets had taken a breather in April, they moved back into their trend lane in May. The US equity indices established new all-time highs. Especially the last month brought out the benefits of diversification in terms of strategies and geographies. A positive outlook prevails.
In Europe we observed a sideward move over the month of May. The highs established in Mid-April could not be reached again, for the time being. While equities of the Eurozone, measured by the Euro Stoxx 50, ended in the red, the broader European market (which includes equities from countries with non-Euro currencies) delivered a positive return.
Outlook
From our perspective, the environment for stock markets looks promising for the next few weeks. After the sharp increase, European equity markets consolidated remarkably in May and in the first two weeks of June while US equities continuously reached new highs in May and just exhibited small losses in the first days of June. The high volatility in other asset classes did not translate into high volatility levels for equity markets. Especially, US stocks seem to be very resilient.
In addition, a lot of market participants turned cautious, increasing their hedges or cash holdings. It can be a good sign. Money that just moved out of the markets could be the potential source for new inflows.
Currently, a high price-earnings (PE) ratio is frequently mentioned as a negative factor against continued market upside. It often ignores the effect of companies’ large cash holdings in this low interest rate environment. Cash holdings increase PE ratios and justify higher levels (lower risk premium demanded). The situation comes with the positive prospect that PE ratios will fall with interest rate increases. Companies with currently high PE ratios might not be as expensive as it seems at first glance. A post on Prof. Damodaran’s blog delivers detailed background.
Also at elevated levels, the closely followed Shiller PE has to be critically examined. It is not reasonable to compare the ratios over longer time periods. Looking at the Shiller PE after adjusting for changes in accounting principles, no significant overvaluation in comparison with the last 30 years can be discovered. Between the end of 2003 and summer 2007, the Shiller PE stood quite consistently at the elevated current level. During these three and a half years, the US equity market moved 40% higher while the maximum drawdown in that period was around 8% for the S&P 500 (own calculations).
Another supporting factor for a continued upward movement is the large share buyback effort. Based on the huge cash piles in combination with the low interest rate environment, the outstanding buyback programs for 2015 will continue to support the demand side.
In Europe, the German DAX underperformed the broader European market since establishing an all-time high in mid-April. Concerns about Greece actually leaving the Eurozone, or probably more the uncertainties about what kind of options are even on the table for Greece, keep investors reluctant from building larger exposures in Europe. Consensus among investors seems to have established that Germany, the premier export nation, will suffer most from a Grexit and the expected appreciation of the Euro.
We do not share this bleak outlook for Germany. The equity index moved up 10% from one year ago. At that point in time, the Euro was 20% more valuable against the US Dollar than today. Also, the oil price was nearly twice as high as it is now. German exporting industries did just fine in that environment and the setting did not include an improving European economy that came up in the data over the last few weeks. Slower growth in China has been expected for months, if not for years, and is priced in. Fundamental data is secondary to our views and models, but a forward PE ratio of 14 for the DAX in combination with several other positive indications, comes with a low probability of further deterioration for German large cap stocks.
For the German stock market, we consider it very likely to be in a similar setting as in October last year. The DAX exhibited underperformance versus its US peers, but from its low in October and without a change in fundamentals or the macro story, the index moved sharply higher in tandem with the US Dollar. The rally ended or maybe just paused in spring this year. We would not be surprised to see this co-movement of DAX and US Dollar again soon.
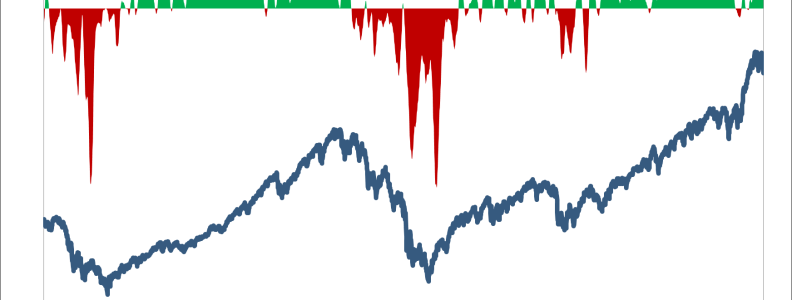
One of our proprietary indicators suggests a safe state for the stock markets in Europe and the US. The indicator is calculated from systematic bottom-up observations of the corresponding stock market and does not belong to the trend following category. A safe state means that the odds for a significant drawdown from a long-term downward rally are low. Over the last 20 years, investments into the stock markets turned out to be comparably safe when the indicator was in the green territory.
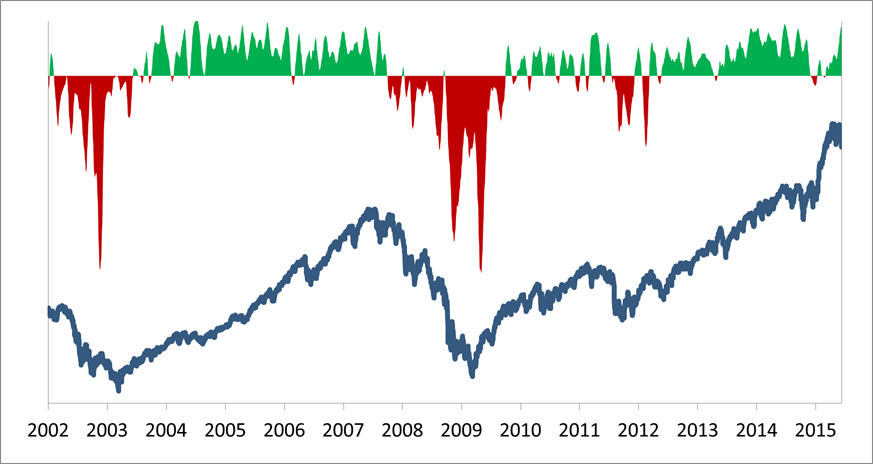
The chart shows the performance of the European stock market with the systematic bottom-up indicator above it.
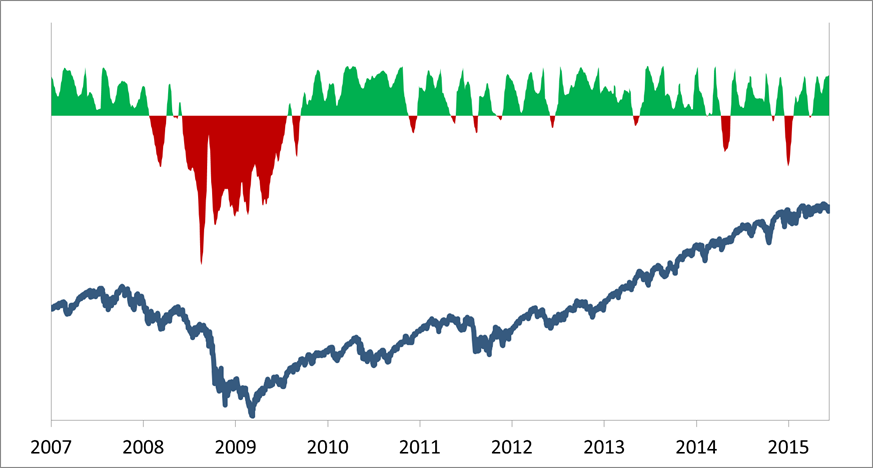
The chart exhibits this constellation for the US stock market.
This indicator highlights our investment philosophy quite well. It is not meant to deliver a perfect forecast but aims to identify the most significant drawdown periods, signaling to exit the market. All other minor market corrections are most often followed by fast recoveries. We are convinced that these minor drawdowns in stock markets, and more generally in all risk asset classes, have to be accepted. Especially for those periods, a well-tested systematic approach is beneficial. Similar drawdown periods and the subsequent market direction can be simulated in the historical data to compare with the prevailing situation.